Do you live in a ‘magnet’ or ‘bedroom’ community?
Job commuting patterns are analyzed after every census in order for the federal Office of Management and Budget to determine the naming and composition of metropolitan and micropolitan areas. While the data have resulted in a number of changes to Michigan’s metropolitan/micropolitan landscape, the individual county flows are of particular relevance in that they help to describe the economic context of each county.
This analysis looks at the 15 largest Michigan counties in reference to their job flows. We analyze: (1) what percentage of residents are employed in their home county; (2) what percentage of county jobs are filled by county residents; (3) what percentage of county jobs are filled by non-county residents; and, (4) what percentage of a county’s resident workers must leave the county for work elsewhere.
When we compare variables 3 and 4, we can determine whether a county is a “magnet” (more folks come in than go out) or “bedroom” (more residents leave than non-residents come in).
Where do workers come from?
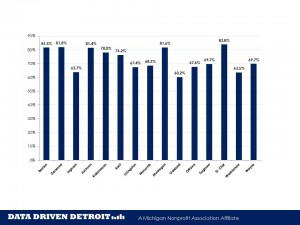
Our first assessment looks at the share of county jobs filled by residents of that county. Higher shares of resident workers indicate an economic structure that is rather self-contained and requires few workers to commute in to fill county jobs. Five counties surpassed the 80 percent mark for “home” workers, with St. Clair leading the pack at 83.8 percent. On the low side, where residents accounted for less than 65 percent of the total work force, were Oakland, Washtenaw and Ingham.
It’s the commuting life for me
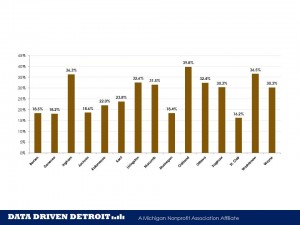
Slide 2 represents the reverse of the first. Here we are looking at the magnet nature of our counties as they provide jobs for non-resident workers. Oakland County is seen to lead all others and, in fact, was highlighted by the Census Bureau as having one of the largest inflows of workers across all U.S. counties – 262,165.
Oakland County employs 396,337 of its residents, while seeing 171,501 residents leave the county to work elsewhere. While its inflows and outflows with Wayne County are essentially the same, the county experiences its greatest magnet strength from Macomb (+51,945), Genesee (+12,854), Livingston (+12,472) and Lapeer (+7,678). Ingham and Washtenaw counties are employment magnets, though their daily inflows are much smaller – 60,096 and 72,872, respectively.
Finding the right label
One measure of magnetism is the number of workers who travel daily to a county to work. We already saw that Oakland County was a national leader with an inflow of 262,165 workers. However, if we just look at total inflows, we see that Wayne brings in 227,054, Macomb 100,916 and Kent 78,274. Though these numbers are significant, there is another factor that must be considered – the number of residents who leave a county each day to work.
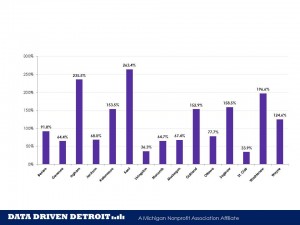
Our final chart looks at the number of workers who come in compared to the number of resident workers who leave. The larger the resulting percentage, the more of a magnet county it is. The smaller the ratio, the more of a bedroom county it is.
This perspective highlights Kent, Ingham and Washtenaw as having the highest magnetic strength among the 15 largest Michigan counties. Oakland County, by virtue of its large outflow of resident workers (171,501), falls well below these three, as do Kalamazoo and Saginaw.
While one would expect the outlying Detroit area counties of Livingston and St. Clair to show up as bedroom counties, the surprise is in the low share exhibited by Macomb County. While 100,916 workers commute in each day to work, 155,951 Macomb residents must leave the county each day for work.
We end with the actual numbers so that you can check my math and create your own tabulations. If you have a county of interest that I did not cover, just email me at kurt@datadrivendetroit.org.
Kurt Metzger is director of Data Driven Detroit, a nonprofit in Detroit established by foundations to build greater capacity for people to work together, and improve lives and communities affiliated with the Michigan Nonprofit Association. He was research director for United Way for Southeastern Michigan from 2005 to 2008 and before that, was a director at the Center for Urban Studies at Wayne State University.
Business Watch
Covering the intersection of business and policy, and informing Michigan employers and workers on the long road back from coronavirus.
- About Business Watch
- Subscribe
- Share tips and questions with Bridge Business Editor Paula Gardner
Thanks to our Business Watch sponsors.
Support Bridge's nonprofit civic journalism. Donate today.
See what new members are saying about why they donated to Bridge Michigan:
- “In order for this information to be accurate and unbiased it must be underwritten by its readers, not by special interests.” - Larry S.
- “Not many other media sources report on the topics Bridge does.” - Susan B.
- “Your journalism is outstanding and rare these days.” - Mark S.
If you want to ensure the future of nonpartisan, nonprofit Michigan journalism, please become a member today. You, too, will be asked why you donated and maybe we'll feature your quote next time!


